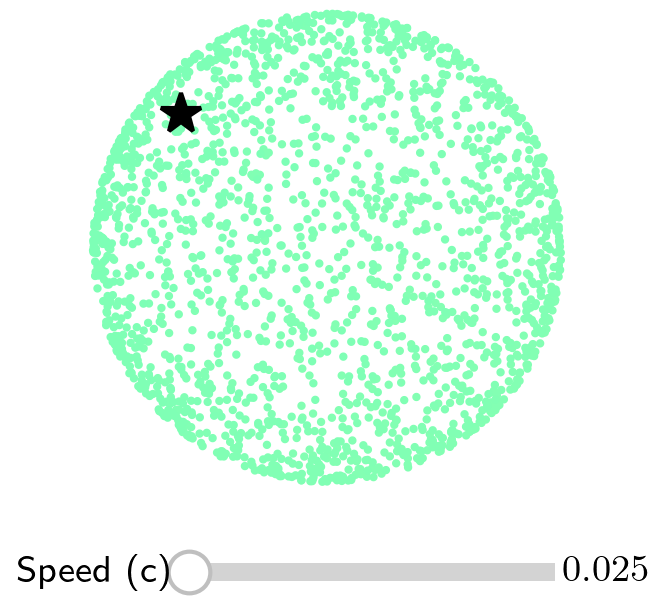
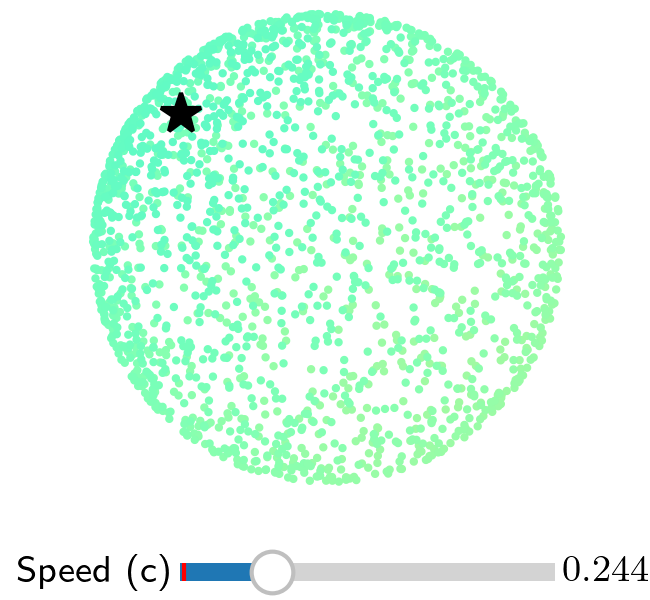
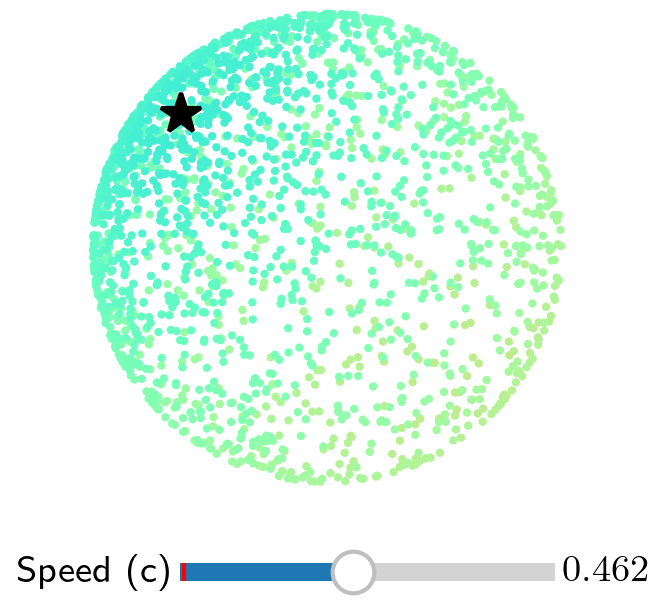
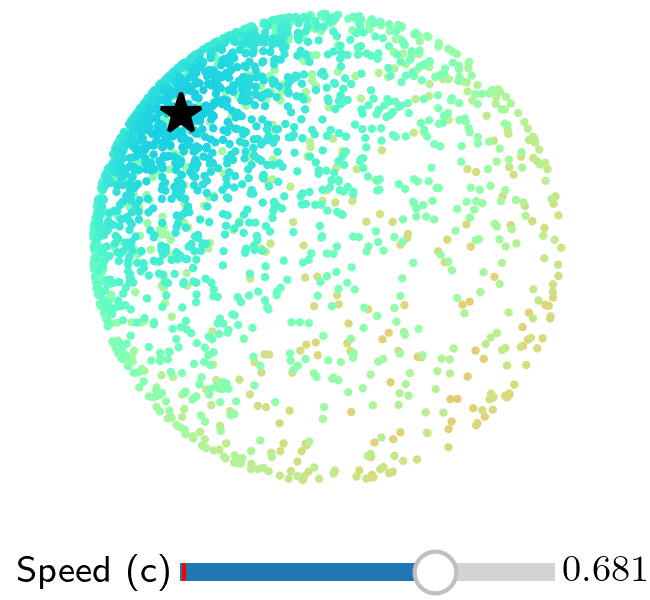
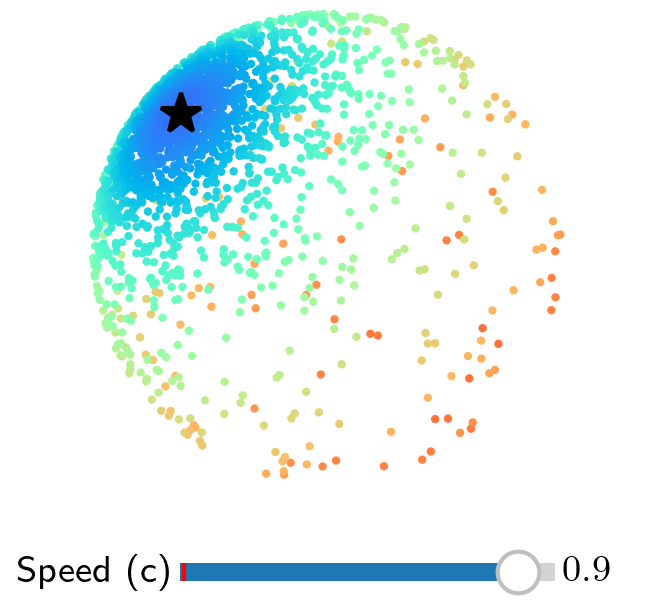
// Fixed simulation inputs. Keeping these together makes the assumed physics
// and the plotted population straightforward to audit.
doppler_config = ({
  nSources: 60000,
  randomSeed: 73,
  differentialCountIndex: 2.5, // dN/dS_nu proportional to S_nu^(-2.5)
  minFlux: 1,
  maxFlux: 100,
  plotMaxFlux: 200,
  nBins: 52,
  spectralIndex: 1,
  cosTheta: 1,                 // small patch in the forward hemisphere
  fluxCut: 5
})Wising up to CatWISE
Using simulation-based inference to measure the cosmic dipole
September 3, 2026
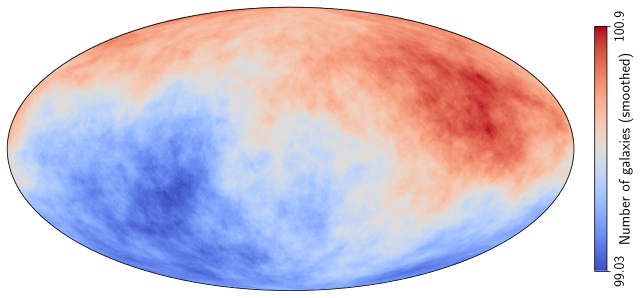
The Kinematic Dipole
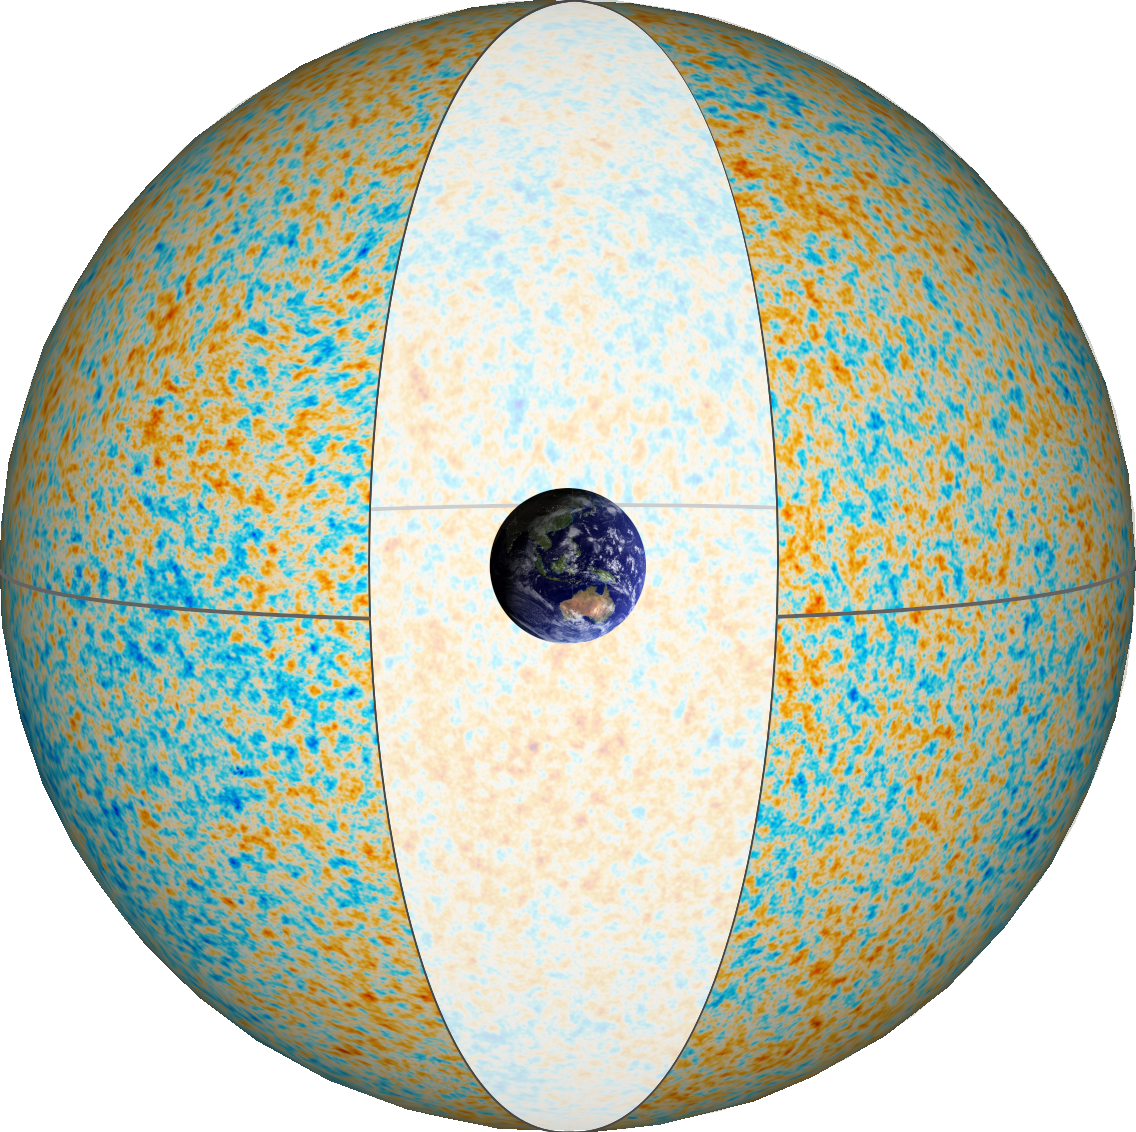
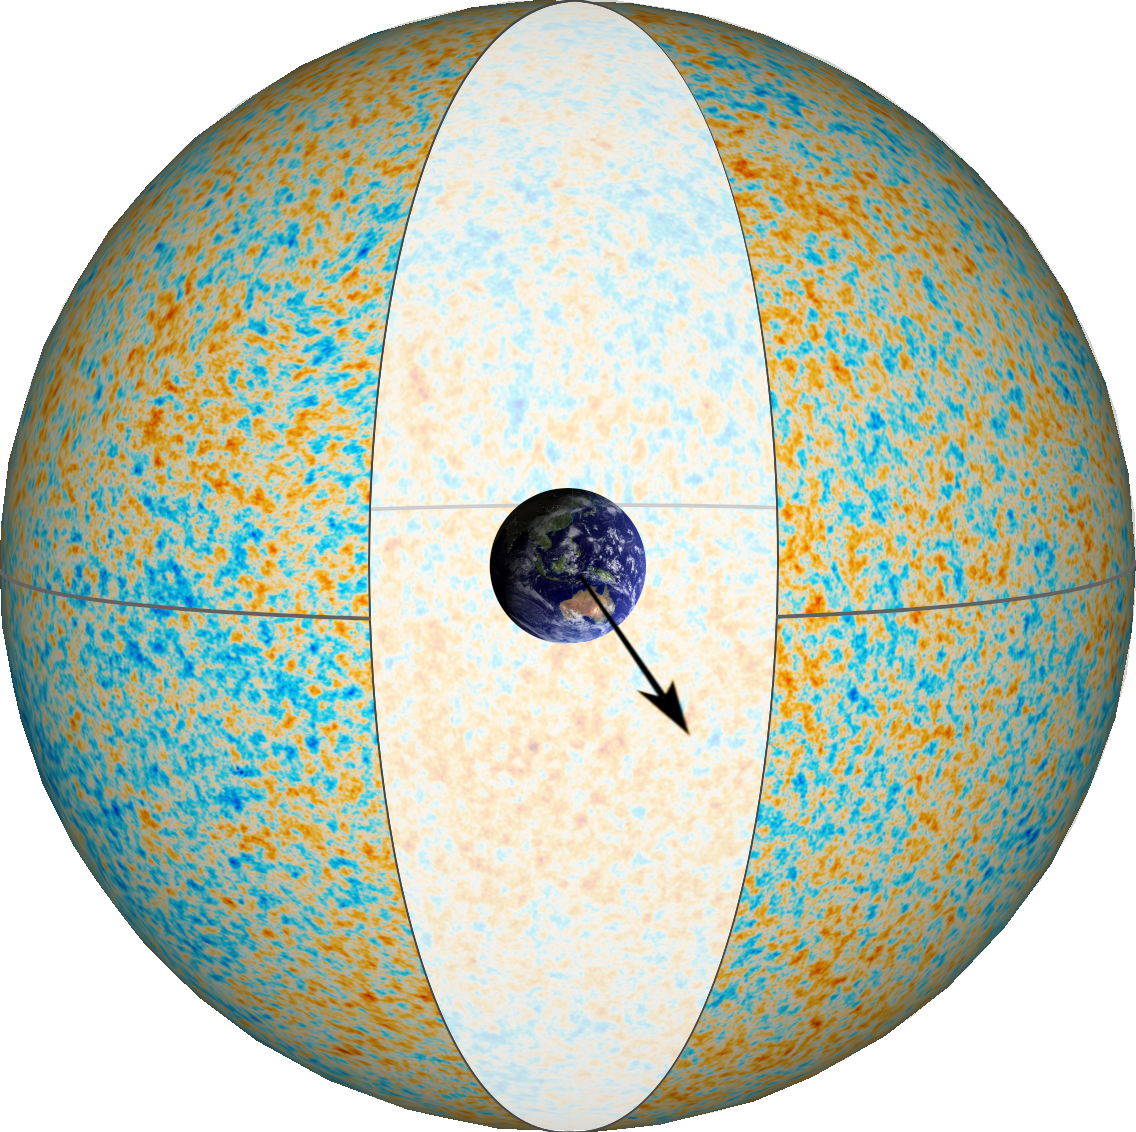
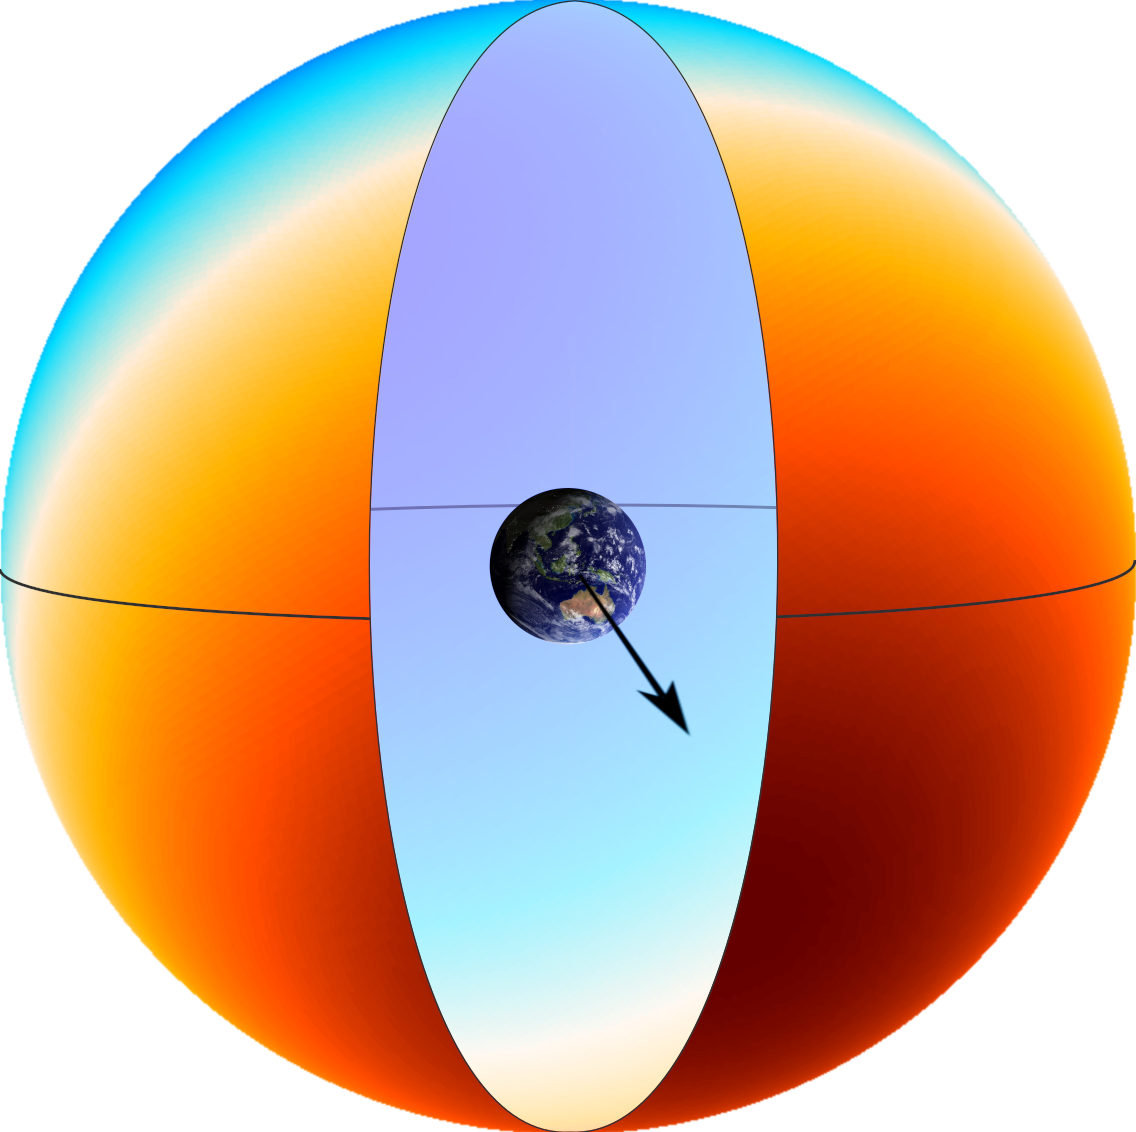
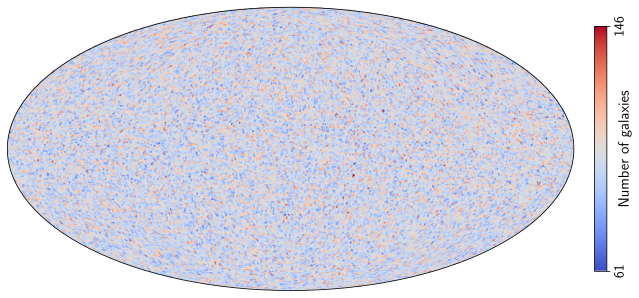
Counting Galaxies
\[ \require{color} \definecolor{secondarycolor}{RGB}{235,129,27} \newcommand{\alertmath}[1]{{\color{secondarycolor}{#1}}} N_{i} = \overline{N} (1 + \alertmath{\mathcal{D}} \cos \theta_i ) \]
Special Relativity
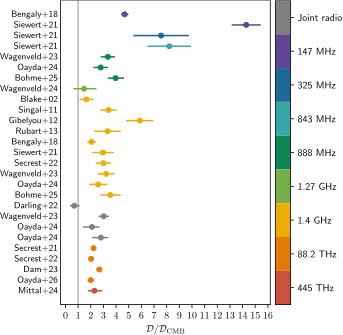
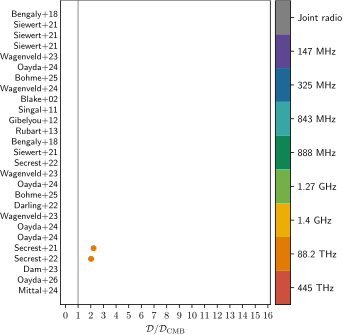
The Amplitude Excess
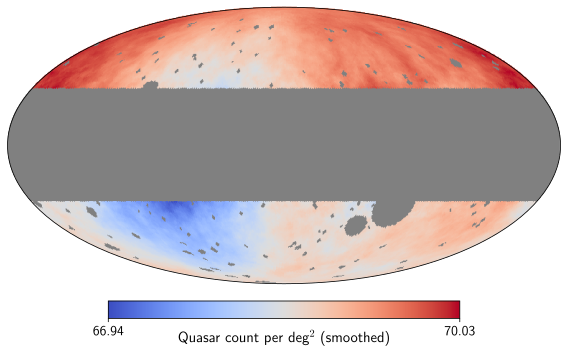
The CatWISE Sample
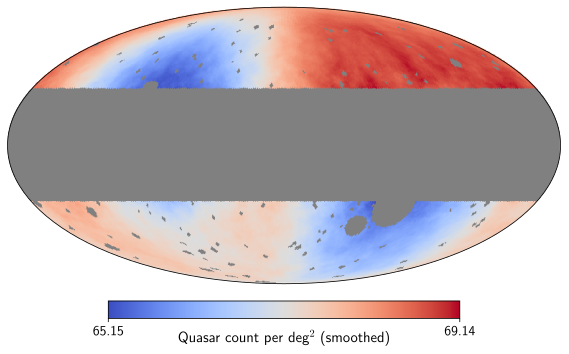
Correcting for the Bias

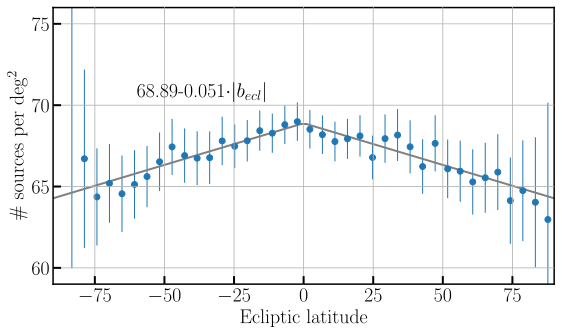
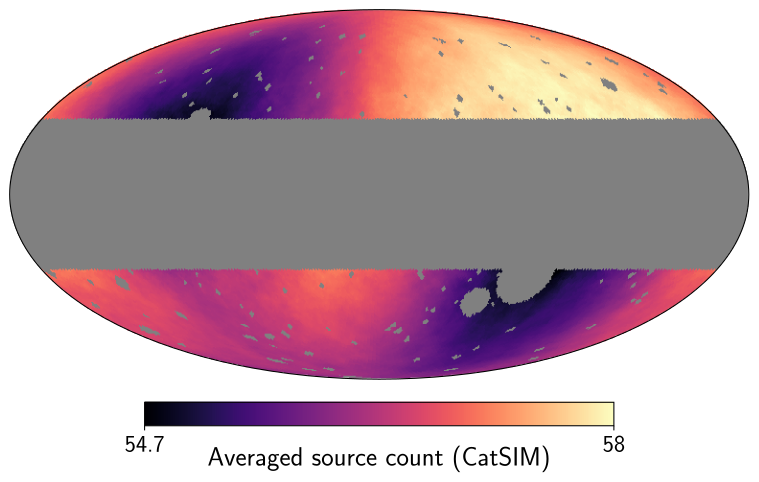
WISE’s Scanning Law
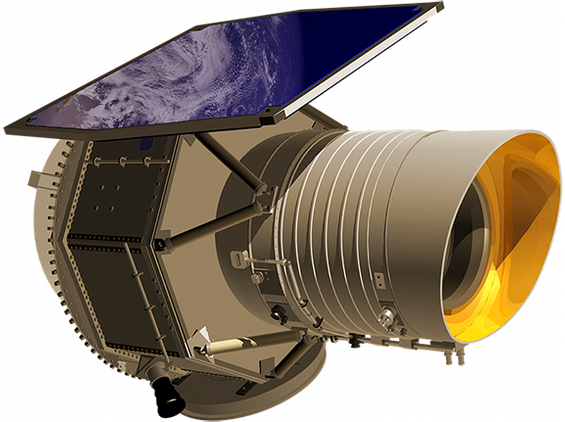
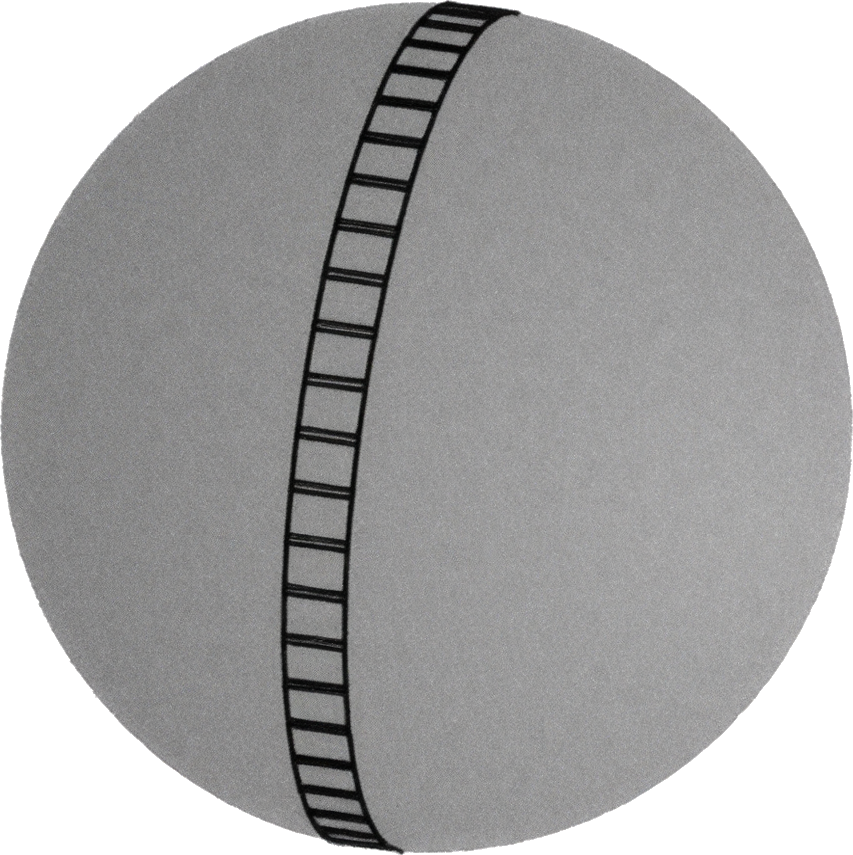
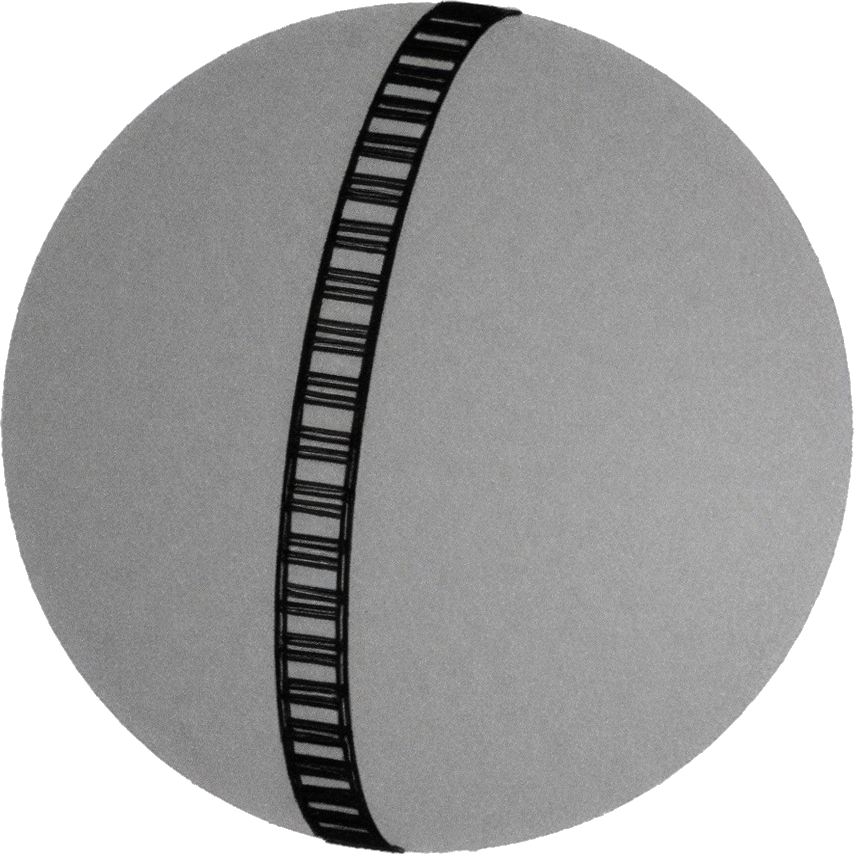
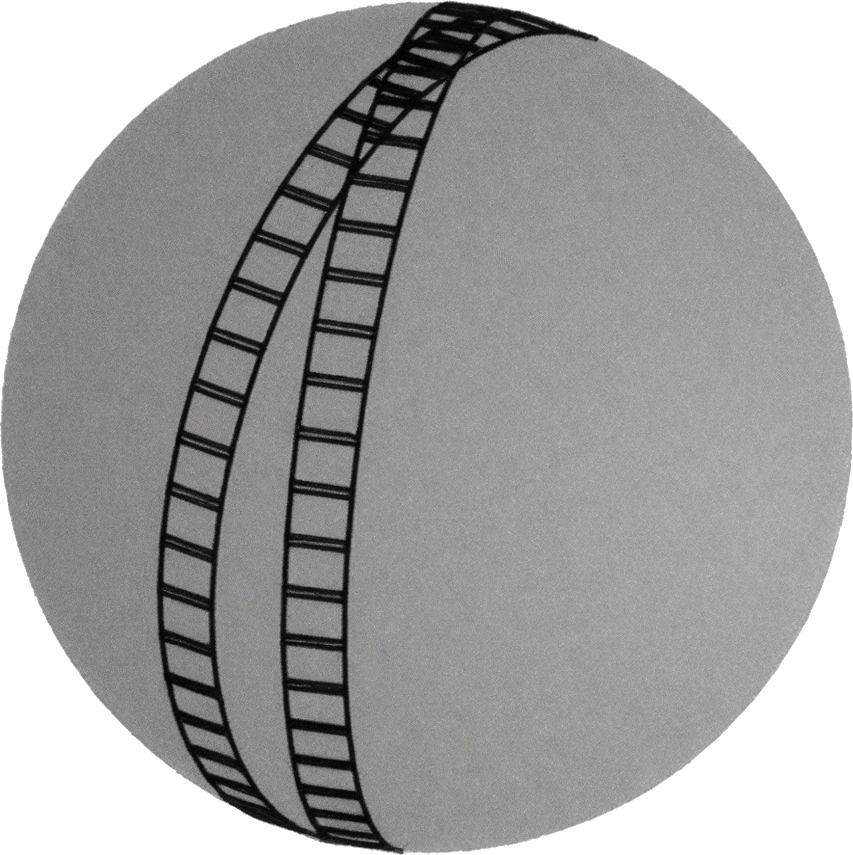
Obeys a scanning law over the survey’s lifetime
Photometric Errors
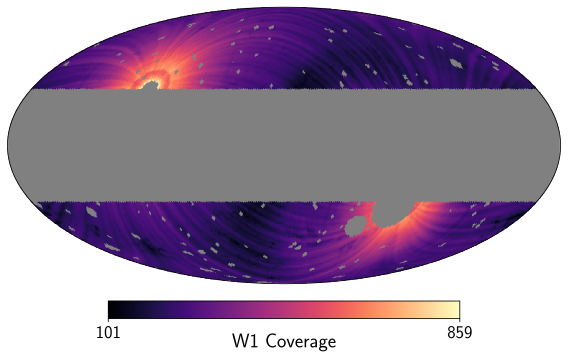
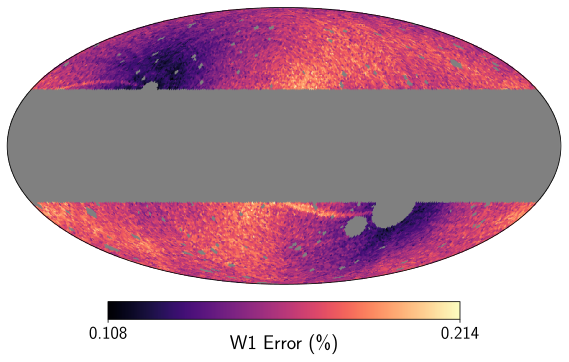
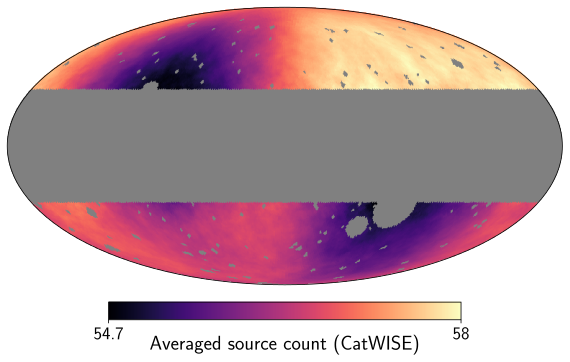
Simulations
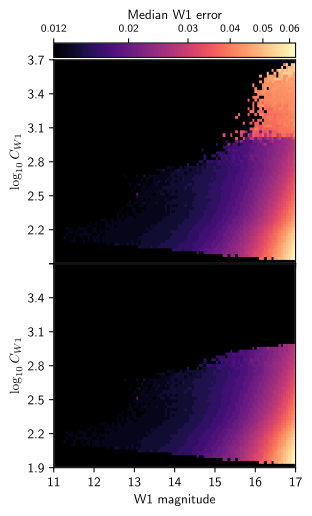
\[m'_{\nu } \to m'_{\nu} + \alertmath{\Delta m'_{\nu}} \]
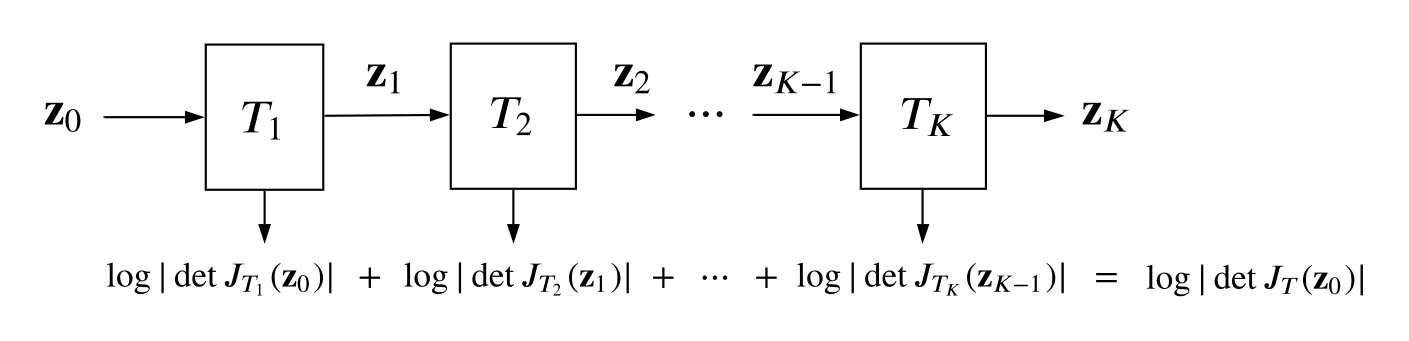
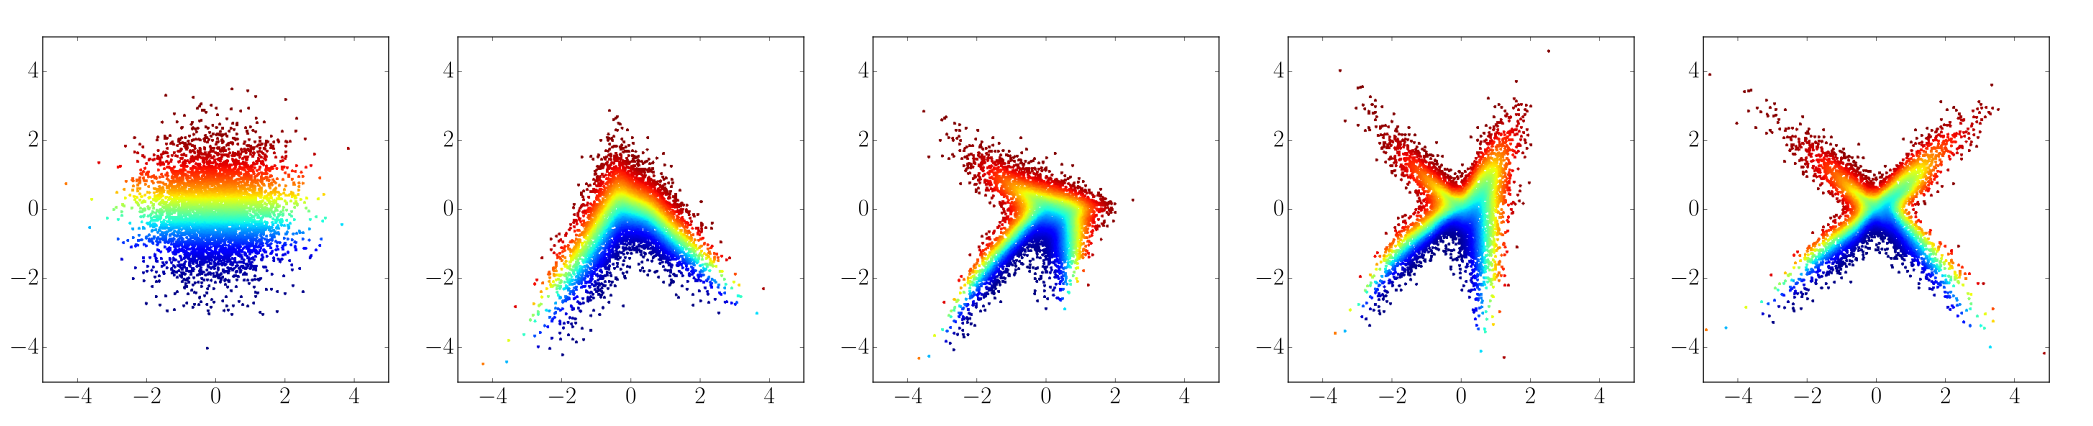
Normalising Flows
- Goal: describe the \(d\)-dimensional base distribution \({\mathcal{L}(\boldsymbol{x}\mid\boldsymbol{\theta})}\).
- We use a series of Masked Autoregressive Flows (MAFs).
- A flow transforms a simple distribution into a complex one.
The Nuts & Bolts
Algorithm: Sequential Neural Likelihood Estimator (SNLE)
Let proposal \(=\) prior
for each training round:
for each simulation this round:
sample \(\boldsymbol{\theta} \hookleftarrow\) proposal
simulate \(\boldsymbol{x} = f_M (\boldsymbol{\theta})\)
append the \( (\boldsymbol{\theta}, \boldsymbol{x}) \) pair
Learn surrogate likelihood \( \mathcal{L} \) using all pairs
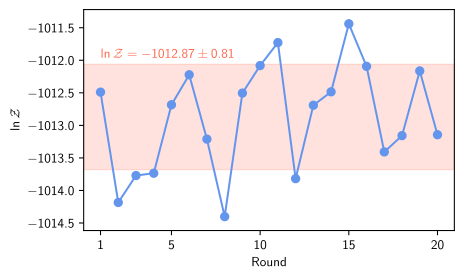
Compute posterior \( \mathcal{P} \) and evidence \(\mathcal{Z} \)
Set proposal \(=\) posterior
return final posterior & evidence estimate
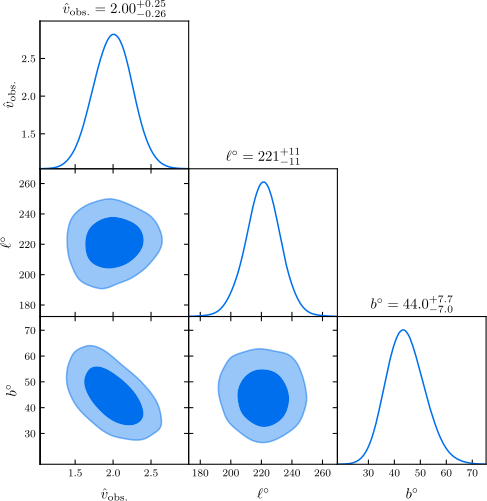
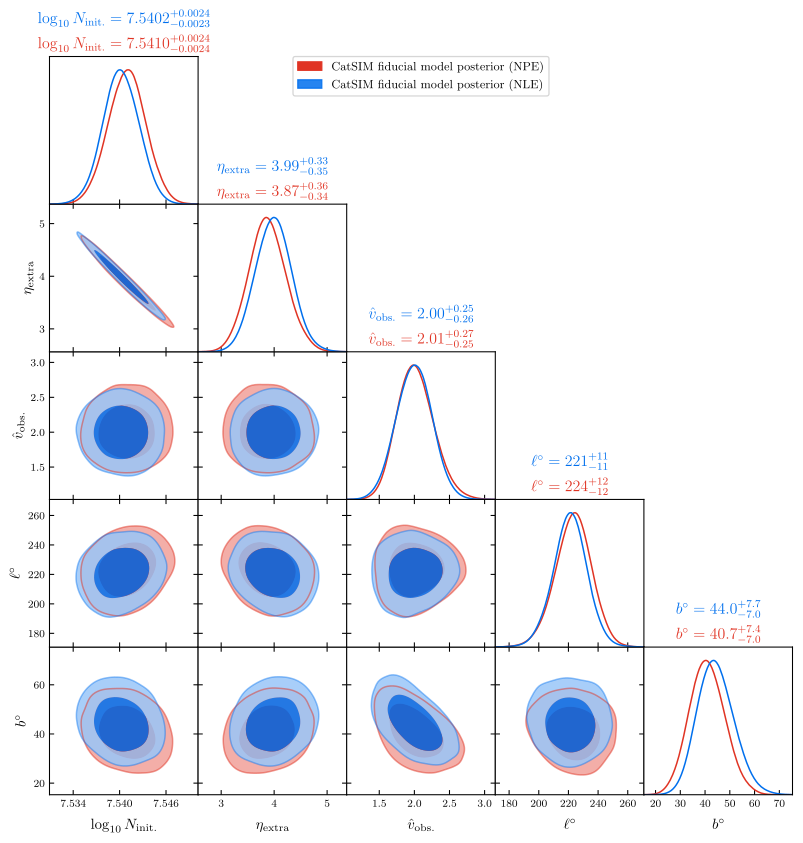
CatSIM Results
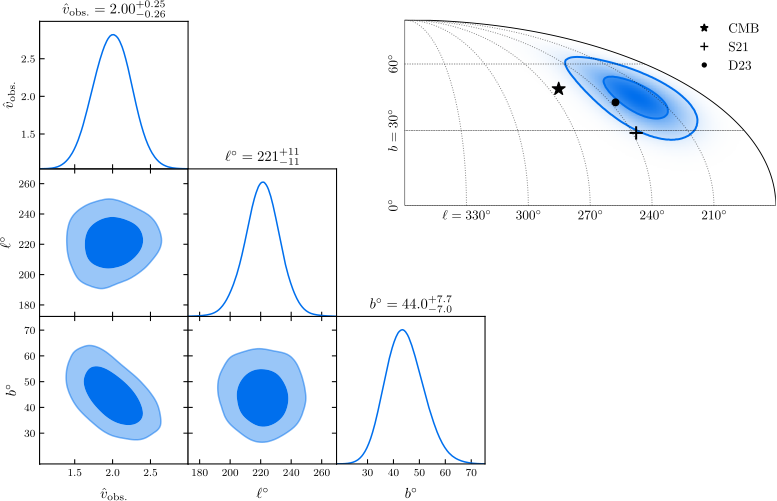
Confirms cosmic dipole tension.
Cracking into RACS?
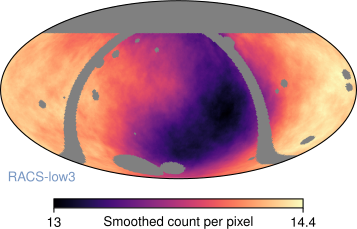
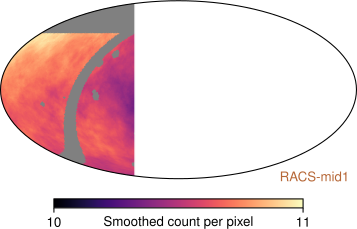
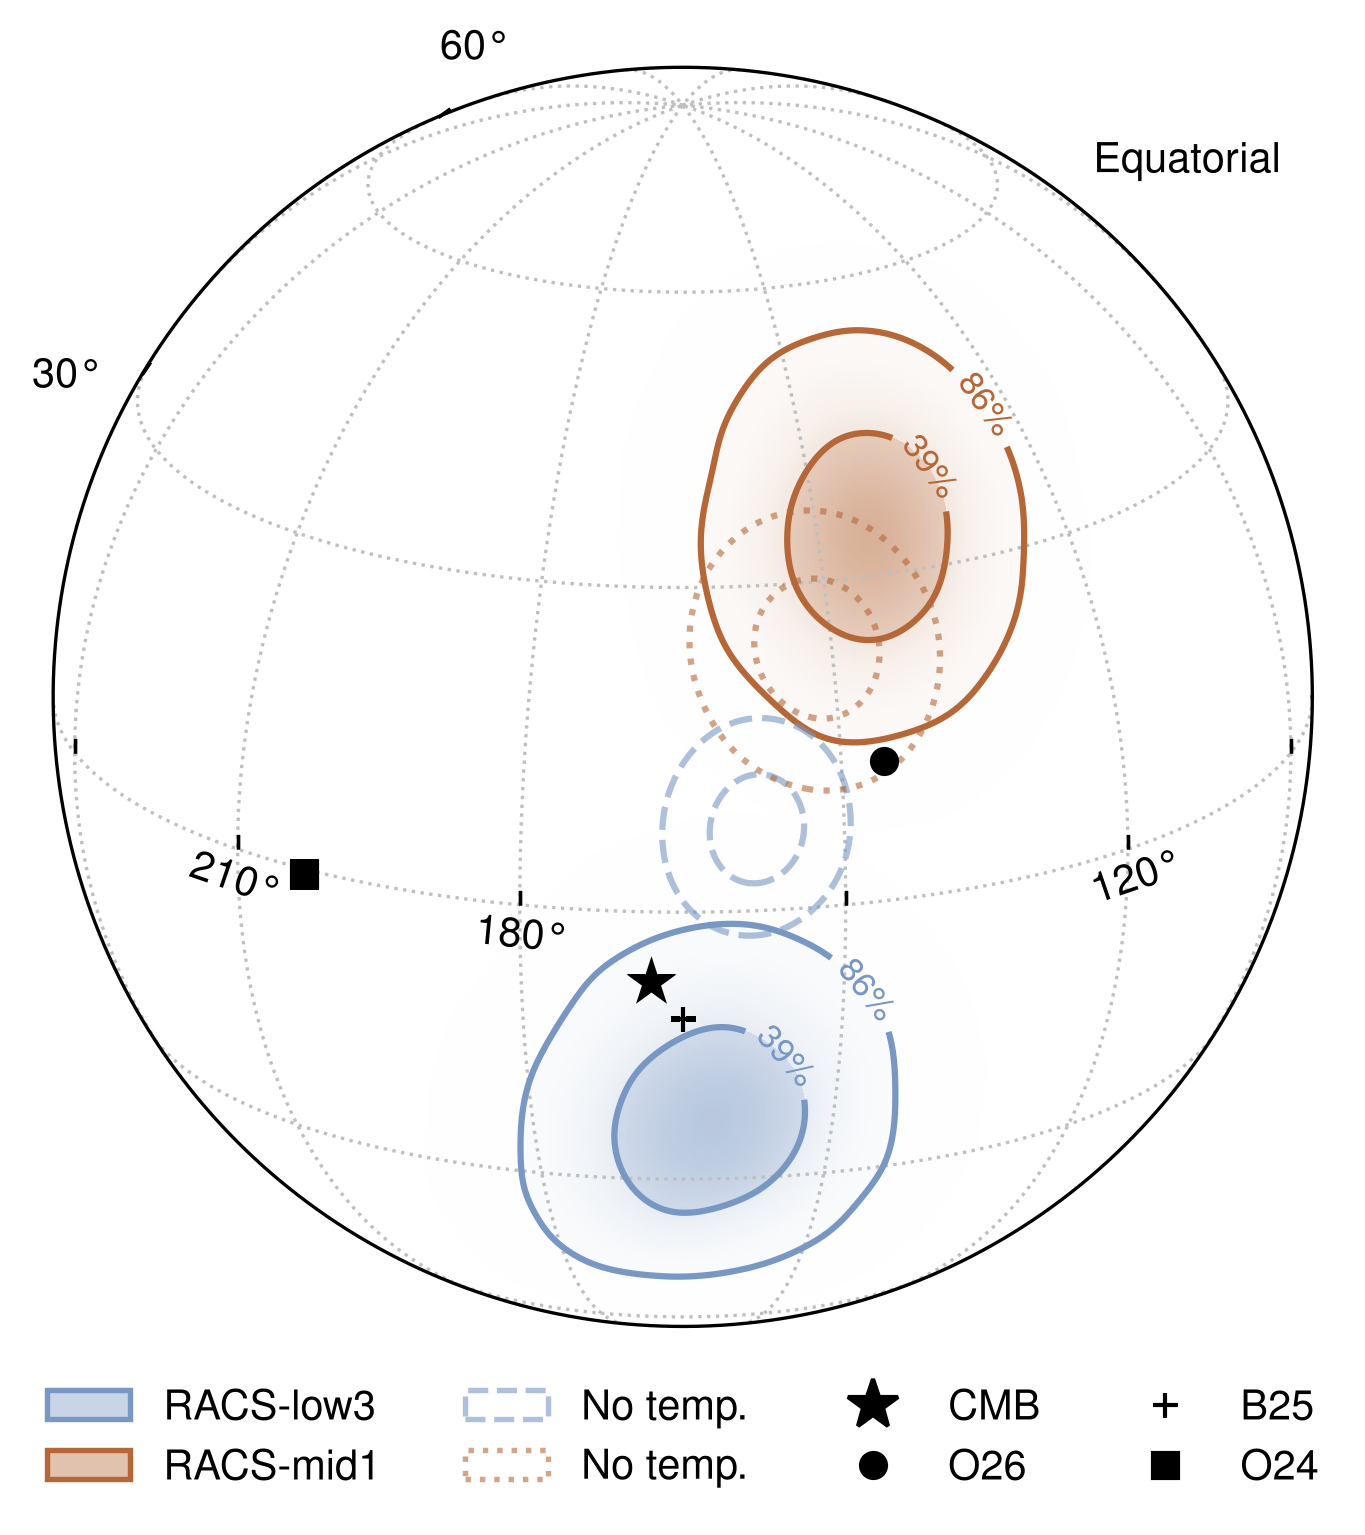
Oayda et al. in preparation, coming very soon…
- Describe and account for ecliptic bias \(\checkmark\)
- Measure cosmic dipole \(\checkmark\)
- Leverage power of simulations and SBI \(\checkmark\)


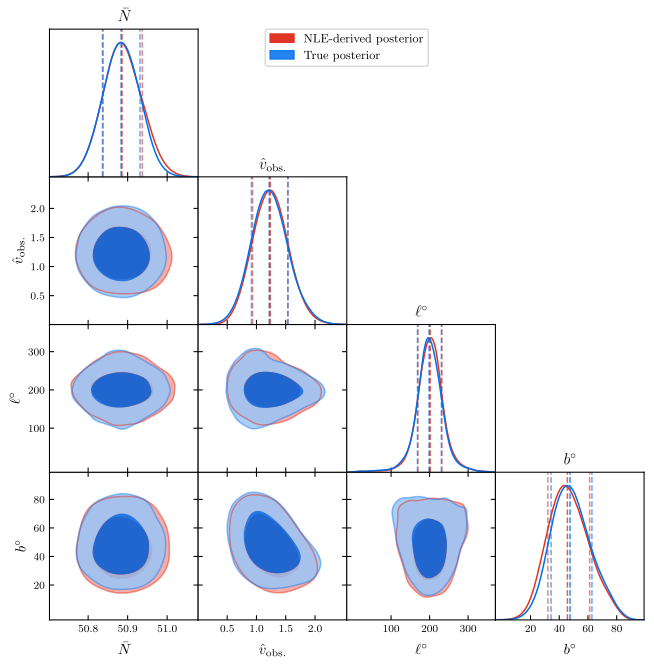
Validation
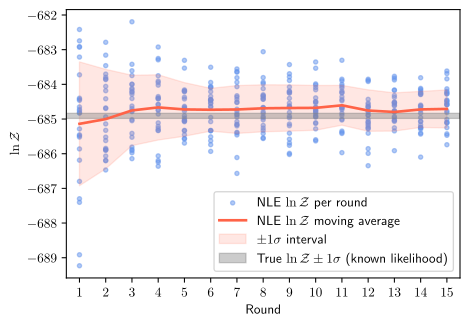
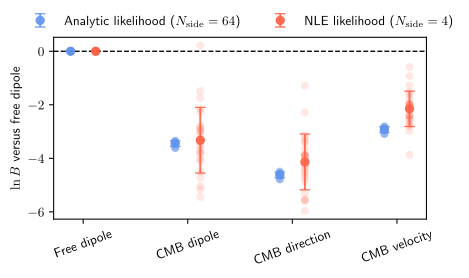
Consistency Check: Bayesian Evidence
- SBI likelihood \(\approx\) analytic likelihood
- \(N_{\mathrm{side}} = 4 \Longleftrightarrow N_{\mathrm{side}} = 64\)
Fiducial Model: SNLE vs. SNPE