Wising up to CatWISE
Using simulation-based inference to measure the cosmic dipole
July 7, 2026
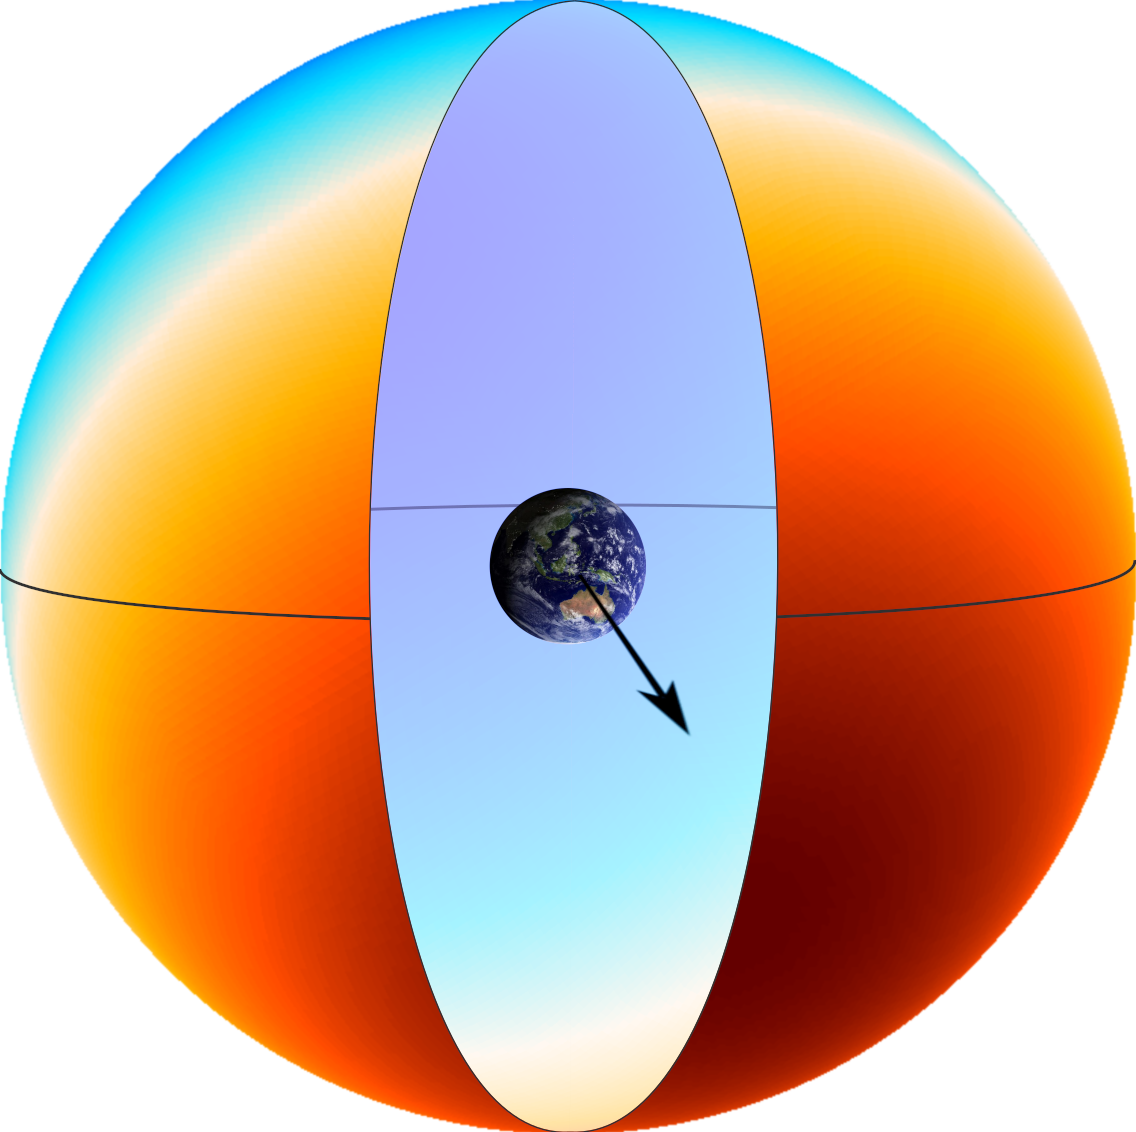
The Kinematic Dipole
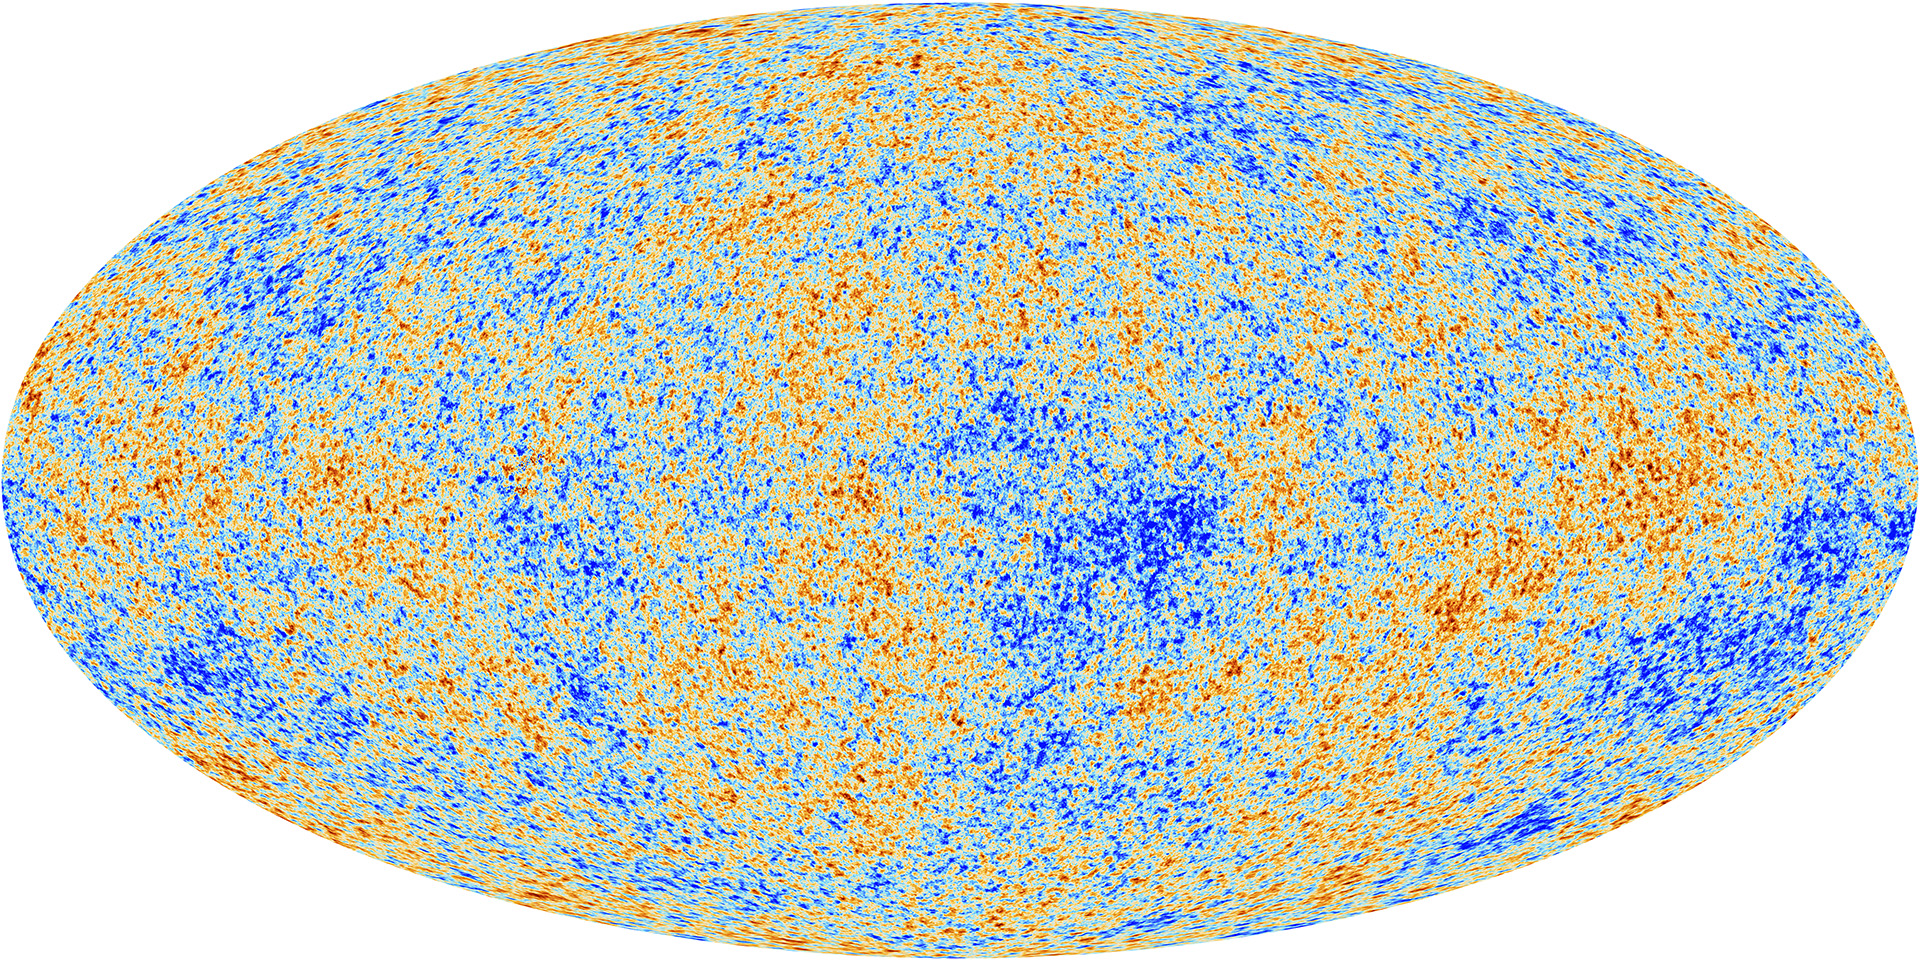
![]()
Counting Galaxies
\[ \require{color} \definecolor{secondarycolor}{RGB}{235,129,27} \newcommand{\alertmath}[1]{{\color{secondarycolor}{#1}}} N_{i} = \overline{N} (1 + \alertmath{\mathcal{D}} \cos \theta_i ) \]


The Amplitude Excess
![]()


The CatWISE Sample


Correcting for the Bias

WISE’s Scanning Law
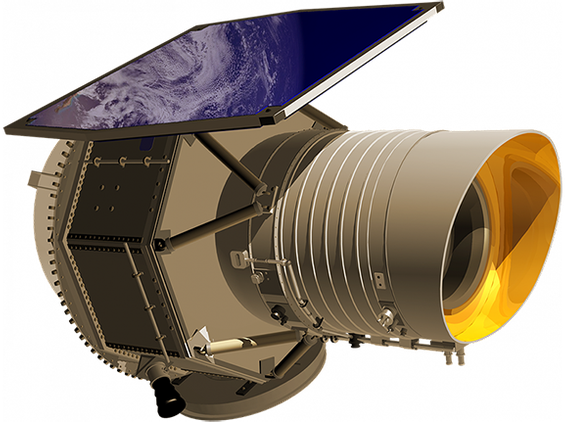
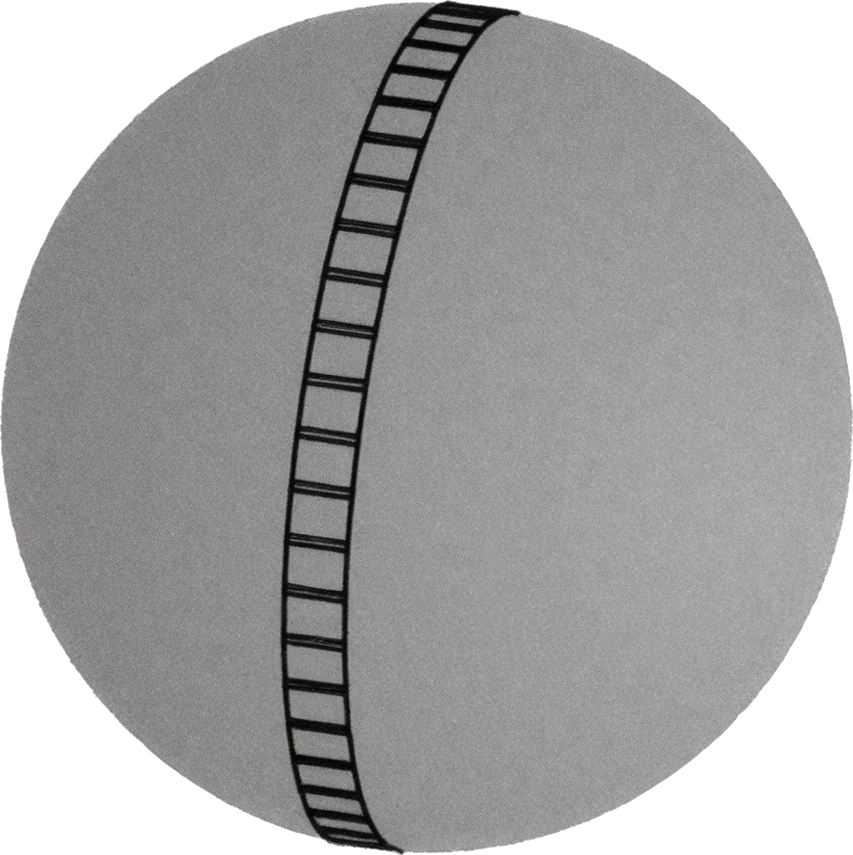
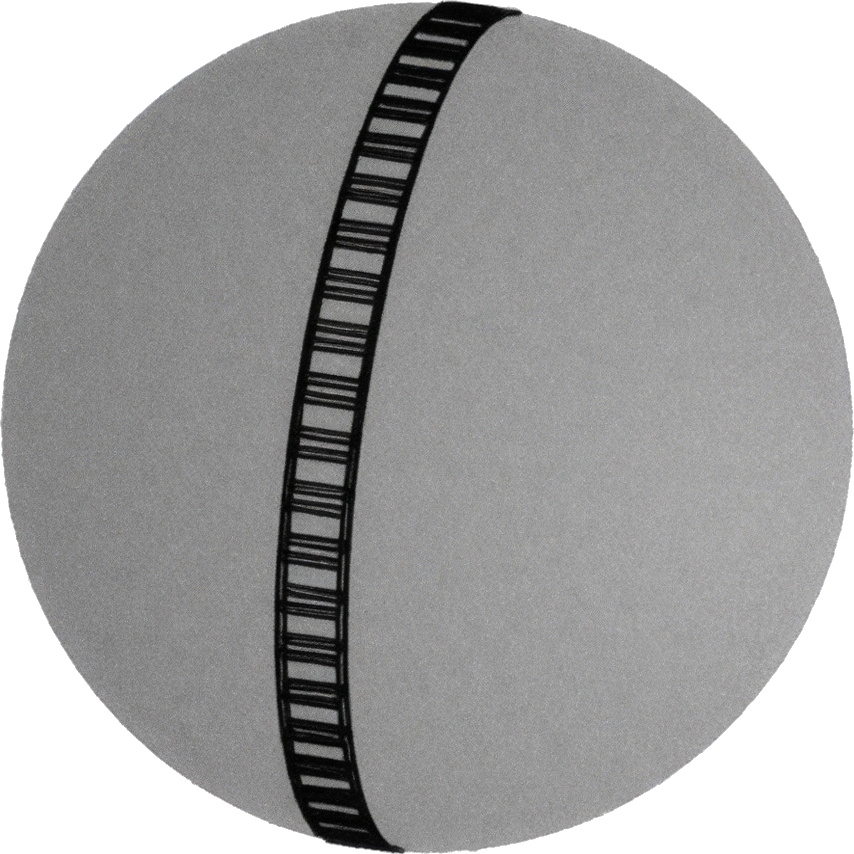
Obeys a scanning law over the survey’s lifetime
Photometric Errors


Simulations

CatSIM Results

Confirms cosmic dipole tension.
Where To Next?


- Can we extend to other surveys?
- Let’s forward model! Account for resolution, flux calibration, etc.
- Infer cosmology and systematics together.
- Describe and account for ecliptic bias \(\checkmark\)
- Measure cosmic dipole \(\checkmark\)
- Leverage power of simulations and SBI \(\checkmark\)